A function to create heatmaps to compare performance with user defined performance criteria
DecisionMap.RdA function to create heatmaps to compare performance with user defined performance criteria
DecisionMap(
  data = NULL,
  method = "XmR",
  peptideThresholdRed = 0.7,
  peptideThresholdYellow = 0.5,
  L = 1,
  U = 5,
  type = "mean",
  title = "heatmap plot",
  listMean = NULL,
  listSD = NULL
)
Arguments
- data
Comma-separated (*.csv), QC file format. It should contain a Precursor column and the metrics columns.
- method
It is either "CUSUM" or "XmR"
- peptideThresholdRed
Is a threshold that marks percentage of peptides above it red on the heatmap. Defaults to 0.7
- peptideThresholdYellow
Is a threshold that marks percentage of peptides above it and below the peptideThresholdRed, yellow on the heatmap. Defaults to 0.5
- L
Lower bound of the giude set. Defaults to 1
- U
Upper bound of the guide set. Defaults to 5
- type
can take two values, "mean" or "dispersion". Defaults to "mean"
- title
the title of the plot. Defaults to "heatmap plot"
- listMean
List of the means for the metrics. If you don't know the means leave it as NULL and they will be calculated automatically by using L and U. The default is NULL.
- listSD
List of the standard deviations for the metrics. If you don't know the standard deviations leave it as NULL and they will be calculated automatically by using L and U. The default is NULL.
Value
A heatmap to aggregate results per metric generated from heatmap.DataFrame data frame.
Examples
# First process the data to make sure it's ready to use
sampleData <- DataProcess(S9Site54)
#> Your data is ready to go!
head(sampleData)
#> AcquiredTime Precursor Annotations MinStartTime MaxEndTime
#> 1 9/19/11 13:14 VLVLDTDYK Not Available 24.30 25.08
#> 2 9/19/11 14:45 VLVLDTDYK Not Available 24.36 25.17
#> 3 9/19/11 16:15 VLVLDTDYK Not Available 24.19 24.96
#> 4 9/19/11 17:46 VLVLDTDYK Not Available 24.22 25.02
#> 5 9/19/11 19:16 VLVLDTDYK Not Available 24.27 25.05
#> 6 9/19/11 20:47 VLVLDTDYK Not Available 24.42 25.22
#> BestRetentionTime TotalArea MaxFWHM missing
#> 1 24.62 116034248 0.29 0
#> 2 24.70 127339240 0.31 0
#> 3 24.53 110745576 0.31 0
#> 4 24.59 130619640 0.31 0
#> 5 24.62 113469472 0.30 0
#> 6 24.76 120836432 0.30 0
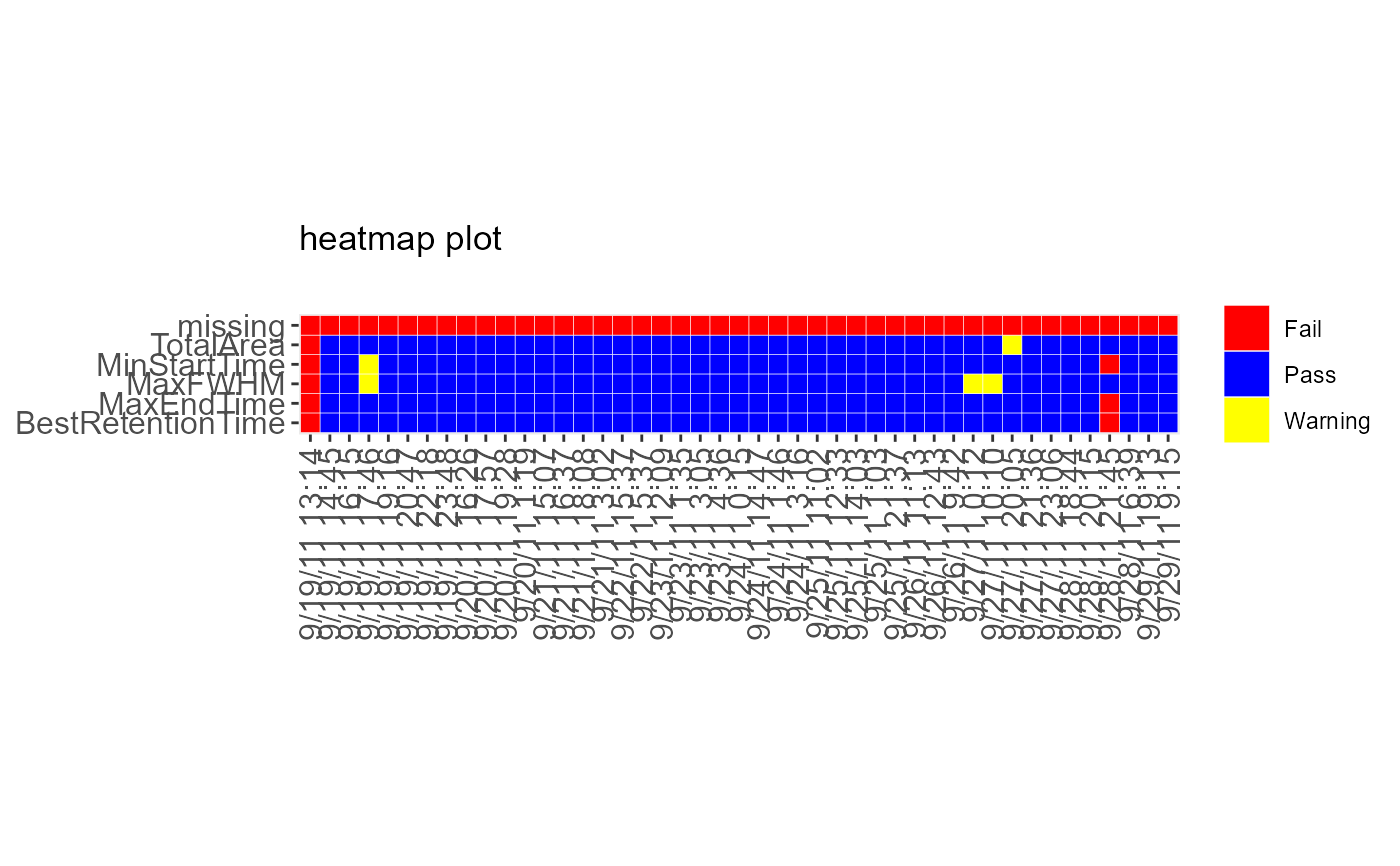
# Draw Decision maker plot
DecisionMap(data = sampleData, method = "CUSUM")
#> Warning: Using `size` aesthetic for lines was deprecated in ggplot2 3.4.0.
#> ℹ Please use `linewidth` instead.
#> ℹ The deprecated feature was likely used in the MSstatsQC package.
#> Please report the issue at
#> <https://groups.google.com/forum/#!forum/msstatsqc>.
#> Warning: Use of `data$time` is discouraged.
#> ℹ Use `time` instead.
#> Warning: Use of `data$metric` is discouraged.
#> ℹ Use `metric` instead.
#> Warning: Use of `data$bin` is discouraged.
#> ℹ Use `bin` instead.
#> Warning: Use of `data$bin` is discouraged.
#> ℹ Use `bin` instead.
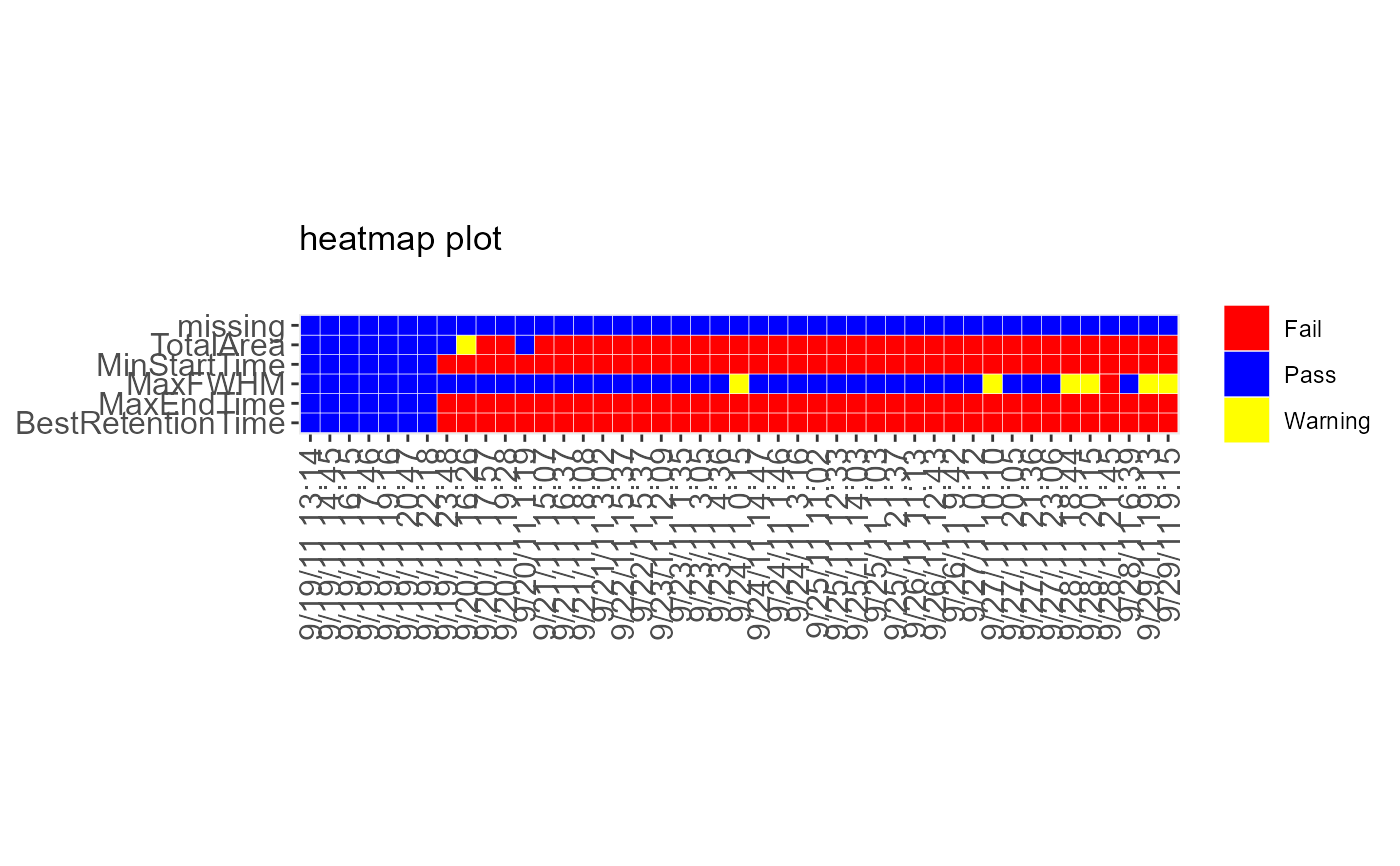 DecisionMap(data = sampleData, method = "CUSUM", type = "variability")
#> Warning: Use of `data$time` is discouraged.
#> ℹ Use `time` instead.
#> Warning: Use of `data$metric` is discouraged.
#> ℹ Use `metric` instead.
#> Warning: Use of `data$bin` is discouraged.
#> ℹ Use `bin` instead.
#> Warning: Use of `data$bin` is discouraged.
#> ℹ Use `bin` instead.
DecisionMap(data = sampleData, method = "CUSUM", type = "variability")
#> Warning: Use of `data$time` is discouraged.
#> ℹ Use `time` instead.
#> Warning: Use of `data$metric` is discouraged.
#> ℹ Use `metric` instead.
#> Warning: Use of `data$bin` is discouraged.
#> ℹ Use `bin` instead.
#> Warning: Use of `data$bin` is discouraged.
#> ℹ Use `bin` instead.
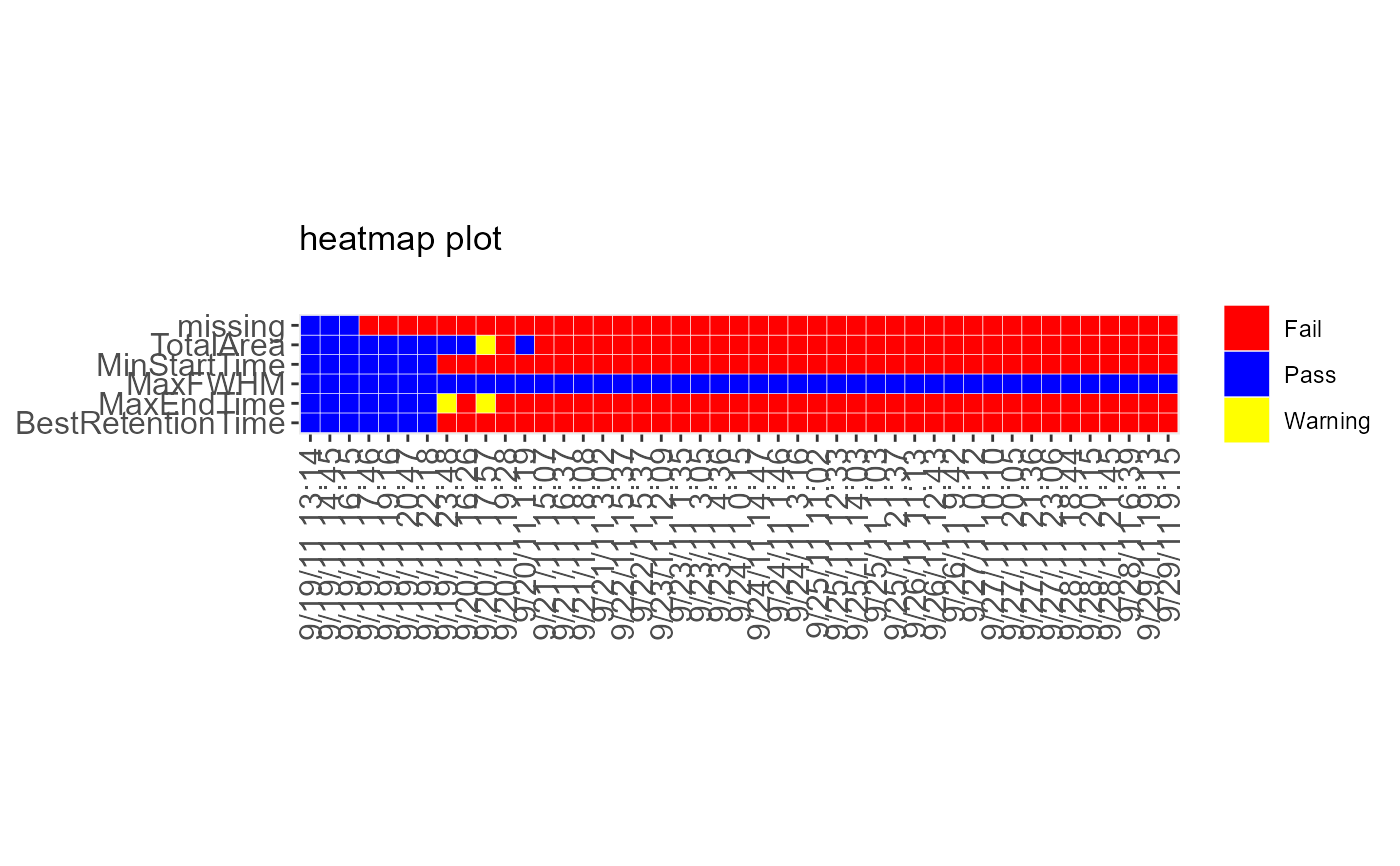 DecisionMap(data = sampleData, method = "XmR")
#> Warning: Use of `data$time` is discouraged.
#> ℹ Use `time` instead.
#> Warning: Use of `data$metric` is discouraged.
#> ℹ Use `metric` instead.
#> Warning: Use of `data$bin` is discouraged.
#> ℹ Use `bin` instead.
#> Warning: Use of `data$bin` is discouraged.
#> ℹ Use `bin` instead.
DecisionMap(data = sampleData, method = "XmR")
#> Warning: Use of `data$time` is discouraged.
#> ℹ Use `time` instead.
#> Warning: Use of `data$metric` is discouraged.
#> ℹ Use `metric` instead.
#> Warning: Use of `data$bin` is discouraged.
#> ℹ Use `bin` instead.
#> Warning: Use of `data$bin` is discouraged.
#> ℹ Use `bin` instead.
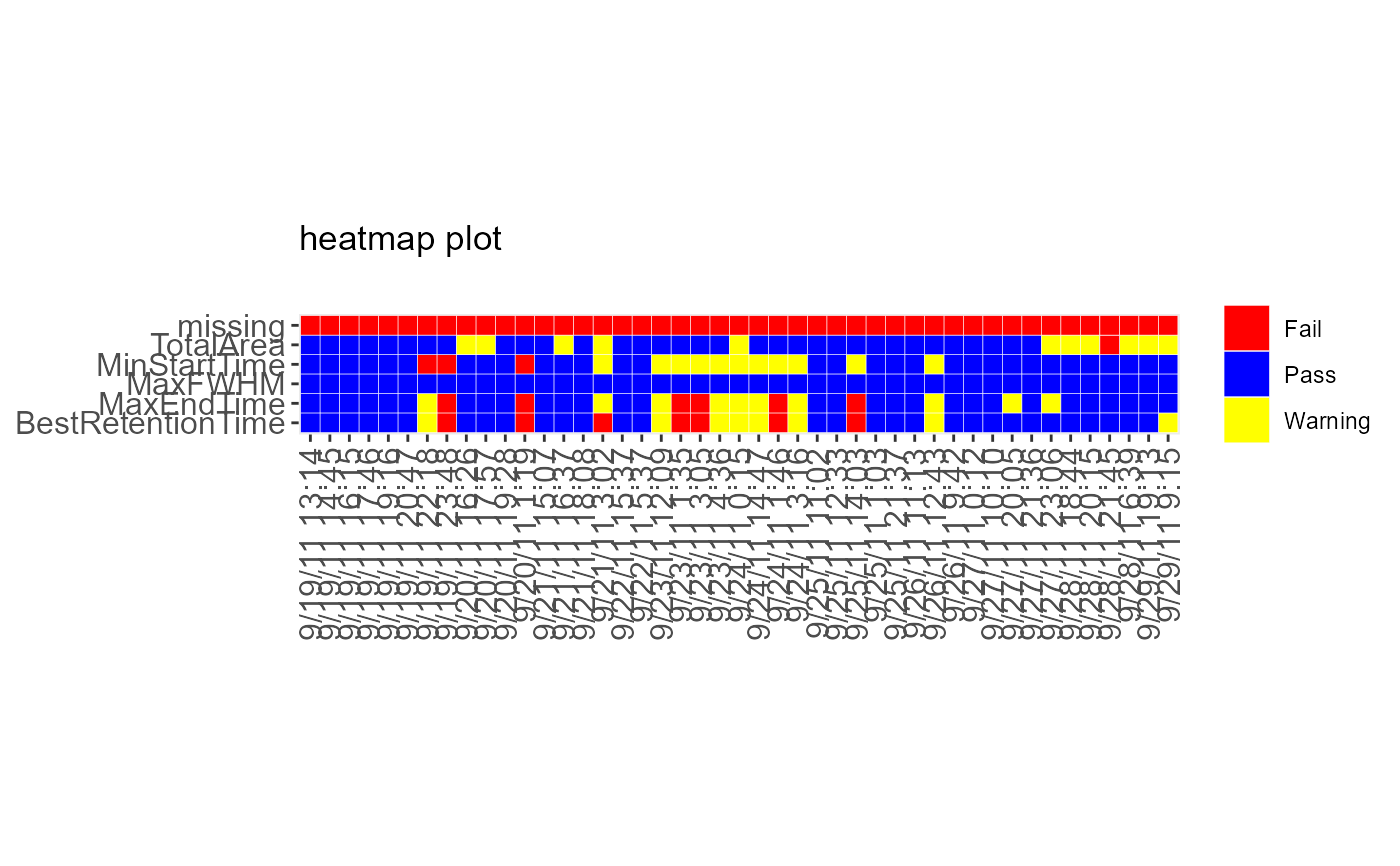 DecisionMap(data = sampleData, method = "XmR", type = "variability")
#> Warning: Use of `data$time` is discouraged.
#> ℹ Use `time` instead.
#> Warning: Use of `data$metric` is discouraged.
#> ℹ Use `metric` instead.
#> Warning: Use of `data$bin` is discouraged.
#> ℹ Use `bin` instead.
#> Warning: Use of `data$bin` is discouraged.
#> ℹ Use `bin` instead.
DecisionMap(data = sampleData, method = "XmR", type = "variability")
#> Warning: Use of `data$time` is discouraged.
#> ℹ Use `time` instead.
#> Warning: Use of `data$metric` is discouraged.
#> ℹ Use `metric` instead.
#> Warning: Use of `data$bin` is discouraged.
#> ℹ Use `bin` instead.
#> Warning: Use of `data$bin` is discouraged.
#> ℹ Use `bin` instead.