A function to create river plot to aggregate results from X and mR charts or CUSUMm and CUSUMv charts.
RiverPlot.RdA function to create river plot to aggregate results from X and mR charts or CUSUMm and CUSUMv charts.
RiverPlot(
  data = NULL,
  L = 1,
  U = 5,
  method = "XmR",
  listMean = NULL,
  listSD = NULL
)
Arguments
- data
omma-separated (.csv), metric file. It should contain a "Precursor" column and the metrics columns. It should also include "Annotations" for each observation.
- L
lower bound of the guide set.
- U
upper bound of the guide set.
- method
defines the method selected to construct control charts.
- listMean
list of the means for each metric. It is used when mean is known. It is NULL when mean is not known. The default is NULL.
- listSD
list of the standard deviations for each metric. It is used when standard deviation is known. It is NULL when mean is not known. The default is NULL.
Value
A river plot to aggregate results per metric generated from XmR.Summary.DataFrame data frame or CUSUM.Summary.DataFrame data frame.
Examples
# First process the data to make sure it's ready to use
sampleData <- DataProcess(S9Site54)
#> Your data is ready to go!
head(sampleData)
#> AcquiredTime Precursor Annotations MinStartTime MaxEndTime
#> 1 9/19/11 13:14 VLVLDTDYK Not Available 24.30 25.08
#> 2 9/19/11 14:45 VLVLDTDYK Not Available 24.36 25.17
#> 3 9/19/11 16:15 VLVLDTDYK Not Available 24.19 24.96
#> 4 9/19/11 17:46 VLVLDTDYK Not Available 24.22 25.02
#> 5 9/19/11 19:16 VLVLDTDYK Not Available 24.27 25.05
#> 6 9/19/11 20:47 VLVLDTDYK Not Available 24.42 25.22
#> BestRetentionTime TotalArea MaxFWHM missing
#> 1 24.62 116034248 0.29 0
#> 2 24.70 127339240 0.31 0
#> 3 24.53 110745576 0.31 0
#> 4 24.59 130619640 0.31 0
#> 5 24.62 113469472 0.30 0
#> 6 24.76 120836432 0.30 0
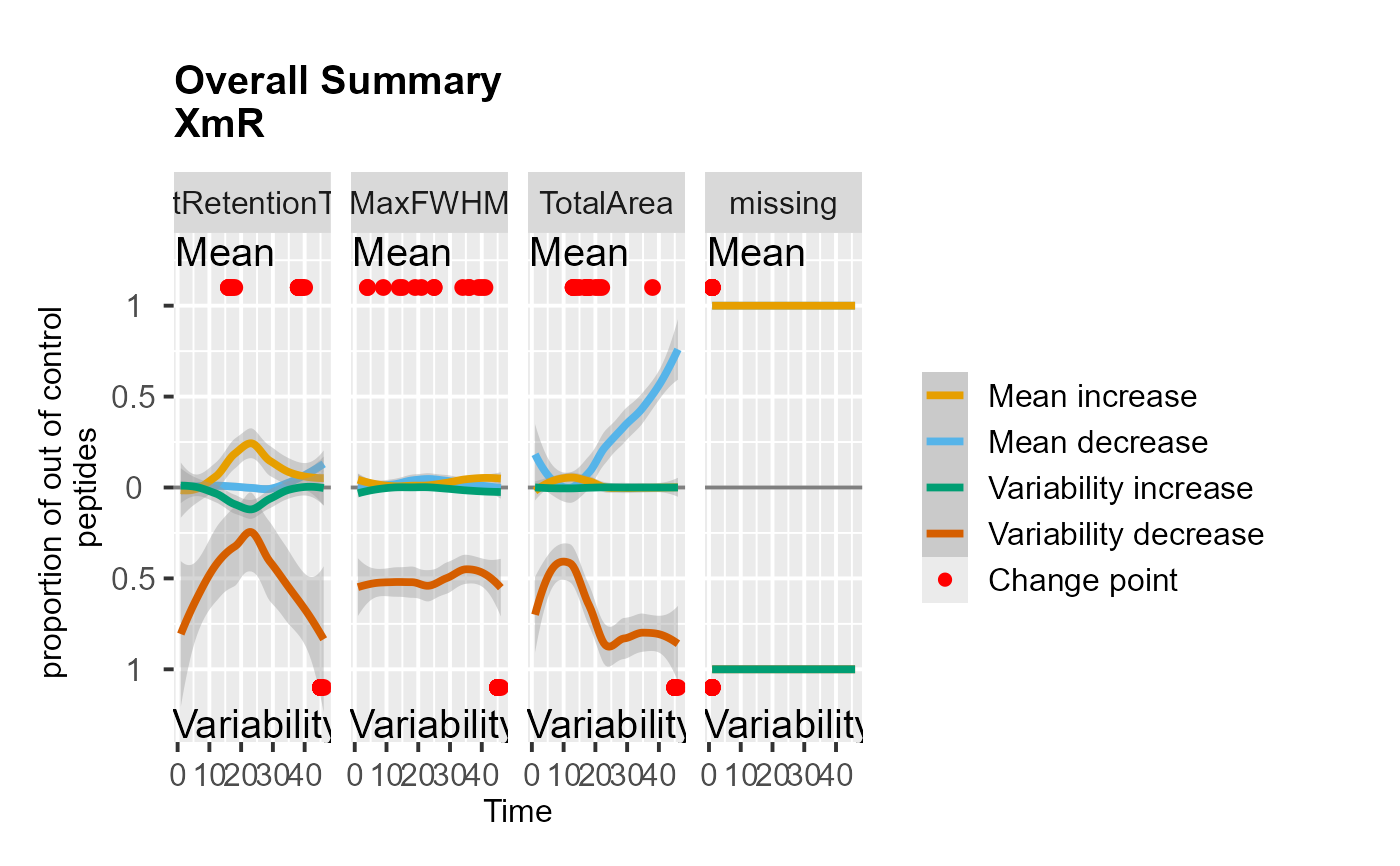
# Draw XmR summary plot
RiverPlot(data = sampleData)
#> Warning: Use of `dat$QCno` is discouraged.
#> ℹ Use `QCno` instead.
#> Warning: Use of `dat$pr.y` is discouraged.
#> ℹ Use `pr.y` instead.
#> Warning: Use of `dat$group` is discouraged.
#> ℹ Use `group` instead.
#> Warning: Use of `dat$group` is discouraged.
#> ℹ Use `group` instead.
#> Warning: Use of `tho.hat.df$tho.hat` is discouraged.
#> ℹ Use `tho.hat` instead.
#> Warning: Use of `tho.hat.df$y` is discouraged.
#> ℹ Use `y` instead.
#> `geom_smooth()` using formula = 'y ~ x'
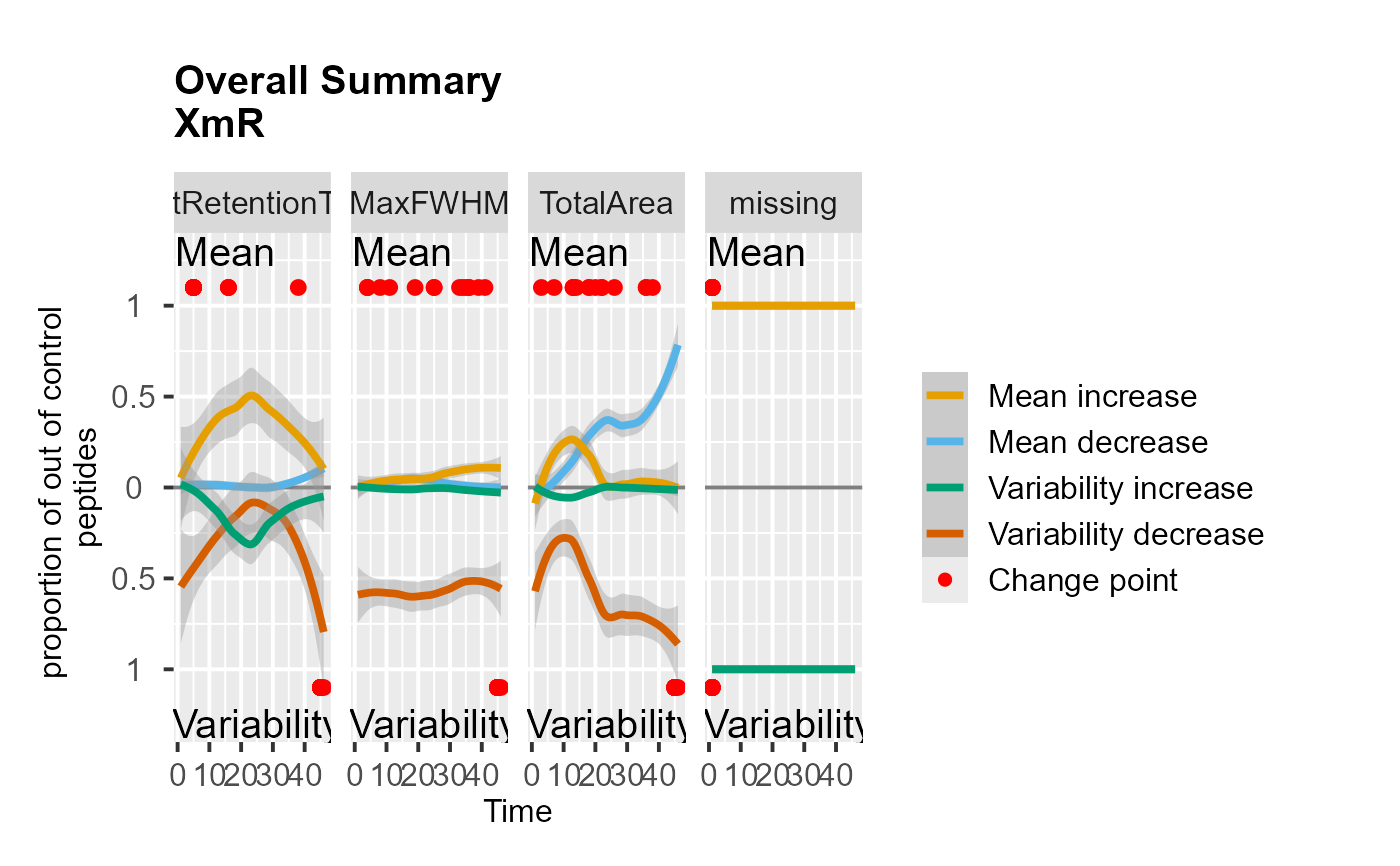 RiverPlot(
data = sampleData, L = 1, U = 20, method = "XmR",
listMean = list(
"BestRetentionTime" = 27.78,
"TotalArea" = 35097129,
"MaxFWHM" = 0.28,
"MinStartTime" = 24
),
listSD = list(
"BestRetentionTime" = 8.19,
"TotalArea" = 34132861,
"MaxFWHM" = 0.054,
"MinStartTime" = 24
)
)
#> Warning: Use of `dat$QCno` is discouraged.
#> ℹ Use `QCno` instead.
#> Warning: Use of `dat$pr.y` is discouraged.
#> ℹ Use `pr.y` instead.
#> Warning: Use of `dat$group` is discouraged.
#> ℹ Use `group` instead.
#> Warning: Use of `dat$group` is discouraged.
#> ℹ Use `group` instead.
#> Warning: Use of `tho.hat.df$tho.hat` is discouraged.
#> ℹ Use `tho.hat` instead.
#> Warning: Use of `tho.hat.df$y` is discouraged.
#> ℹ Use `y` instead.
#> `geom_smooth()` using formula = 'y ~ x'
RiverPlot(
data = sampleData, L = 1, U = 20, method = "XmR",
listMean = list(
"BestRetentionTime" = 27.78,
"TotalArea" = 35097129,
"MaxFWHM" = 0.28,
"MinStartTime" = 24
),
listSD = list(
"BestRetentionTime" = 8.19,
"TotalArea" = 34132861,
"MaxFWHM" = 0.054,
"MinStartTime" = 24
)
)
#> Warning: Use of `dat$QCno` is discouraged.
#> ℹ Use `QCno` instead.
#> Warning: Use of `dat$pr.y` is discouraged.
#> ℹ Use `pr.y` instead.
#> Warning: Use of `dat$group` is discouraged.
#> ℹ Use `group` instead.
#> Warning: Use of `dat$group` is discouraged.
#> ℹ Use `group` instead.
#> Warning: Use of `tho.hat.df$tho.hat` is discouraged.
#> ℹ Use `tho.hat` instead.
#> Warning: Use of `tho.hat.df$y` is discouraged.
#> ℹ Use `y` instead.
#> `geom_smooth()` using formula = 'y ~ x'